Explainers · Before and after

Climate change before and after: satellite images

Satellites have watched the same places for decades. These NASA images show what change looks like on the ground — and the captions say honestly how much of it is climate.

By Andreas Marshall · Last reviewed 31 October 2026 · Every claim is linked to its source below.

An ice shelf gone in a month: Larsen B, Antarctica

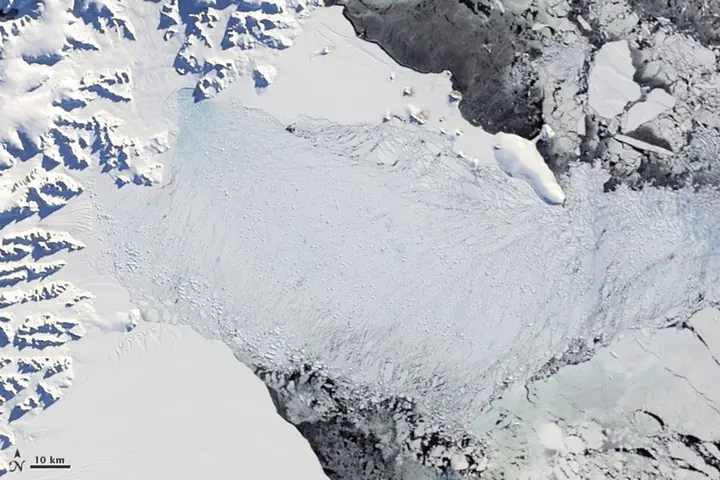
Larsen B Ice Shelf, 31 January and 13 April 2002
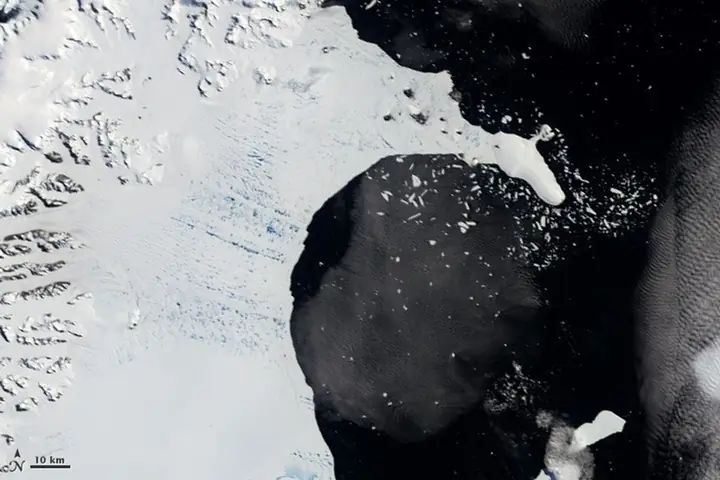
Satellite image of the intact Larsen B ice shelf, a flat white sheet bordered by dark open water.31 Jan 2002
The same area ten weeks later, where the shelf has shattered into a pale mass of floating ice fragments.13 Apr 2002
NASA Earth Observatory; MODIS on NASA's Terra satellite. Public domain.

In the southern summer of 2002, about 3,250 km² of the Larsen B Ice Shelf — larger than Luxembourg — broke apart in just over a month. NASA attributes it to a series of warm summers on the Antarctic Peninsula, ending in an exceptionally warm one: meltwater ponds on the surface deepened cracks until the shelf split. Afterwards, the glaciers that the shelf had held back sped up by about 300% on average, sending more ice into the sea.

Glaciers disappearing: Glacier National Park, USA

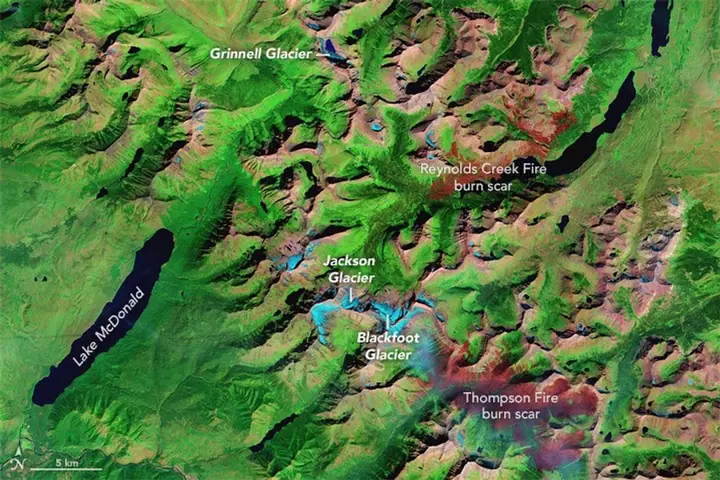
Glacier National Park, Montana, 17 August 1984 and 23 August 2015
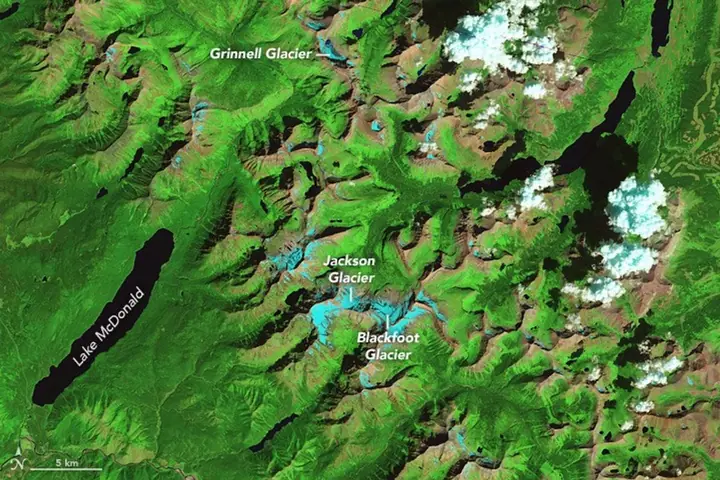
False-colour satellite image of Glacier National Park with glaciers shown as light blue patches, including Grinnell, Jackson and Blackfoot glaciers.1984
The same view in 2015, with visibly smaller light blue glacier patches and red burn scars from wildfires.2015
NASA Earth Observatory; Landsat 5 and Landsat 8 data from the U.S. Geological Survey. Public domain. Glaciers appear light blue.

About 150 glaciers were documented here in 1850. In 1968, surveys counted 83 bodies of ice and snow larger than 0.1 km²; NASA now counts 25. Warm summers and changes in snowfall drive the loss, and NASA attributes most of it to decades of warming rather than year-to-year weather. The red patches in 2015 are scars from wildfires.

A glacier in retreat: Columbia Glacier, Alaska

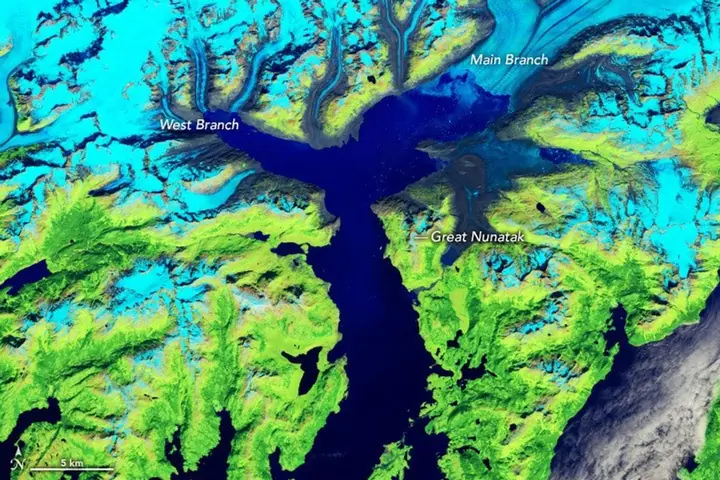
Columbia Glacier, Alaska, 28 July 1986 and 5 August 2024
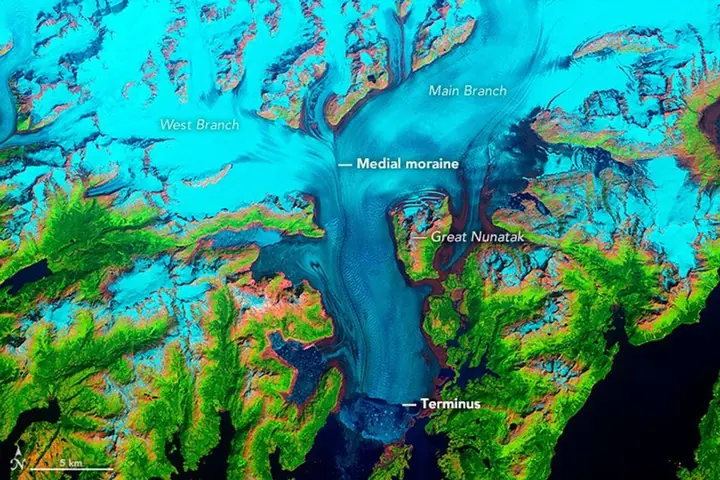
False-colour satellite image of Columbia Glacier filling a long valley down to the sea, shown in light blue.1986
The same view in 2024: the lower glacier is gone and the valley is filled with dark blue sea water.2024
NASA Earth Observatory images by Jesse Allen and Robert Simmon; Landsat data from the U.S. Geological Survey. Public domain. Ice and snow appear light blue, vegetation green.

Since the 1980s the main branch of Columbia Glacier has retreated more than 20 km and lost more than half of its thickness and volume. This one is not simply a thermometer: NASA notes that climate change may have given the glacier an initial push, but once it lost its footing on the moraine at its front, its own mechanics — faster flow and calving — drove most of the retreat.

A reservoir draining: Lake Powell, USA

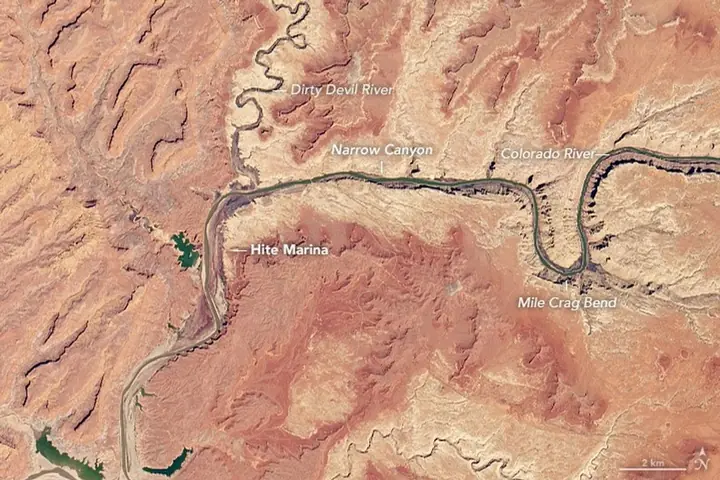
Lake Powell near Hite, Utah, 25 March 1999 and 30 April 2021
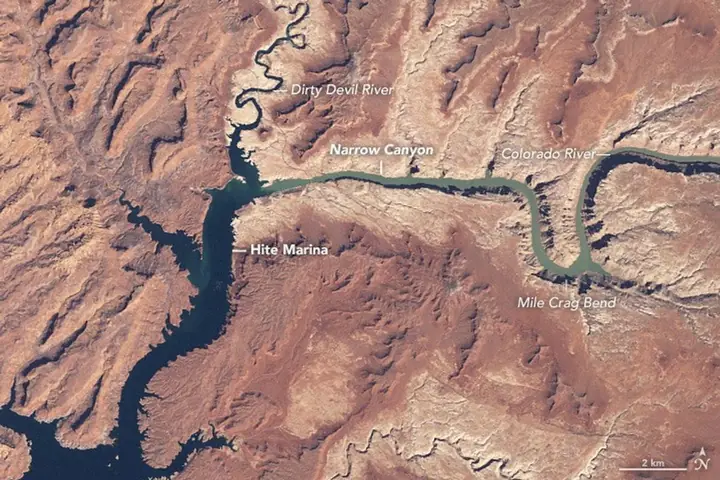
Satellite image of Lake Powell as a broad dark blue lake filling the canyons near Hite Marina.1999
The same view in 2021: the lake has shrunk to a narrow river channel and Hite Marina is far from the water.2021
NASA Earth Observatory; natural-colour Landsat data from the U.S. Geological Survey. Public domain.

In 1999 Lake Powell was nearly full. By 2021 the arm near Hite Marina had shrunk to a river channel. NASA attributes the decline to prolonged drought in the US Southwest combined with water withdrawals that many consider unsustainable. NASA also notes that the droughts so far are not unusual compared with tree-ring records of past centuries — but that global warming is expected to make droughts more severe.

What it means

Ice responds to warming in plain sight: shelves that took thousands of years to form can break up in weeks, and mountain glaciers that were mapped in the 1800s are now down to a fraction. Other changes, like a falling reservoir, are climate stacked on top of human choices — which also means they can be managed.

For what lies ahead, see where dangerous heat spreads, how fast the sea is rising and Arctic sea ice today.

Frequently asked questions

Are there real photos that show climate change?

Yes. Satellites have photographed the same places for decades. NASA's Landsat and MODIS images show glaciers retreating, ice shelves collapsing and reservoirs shrinking. The images on this page come from NASA Earth Observatory and are in the public domain.

Is every change in these images caused by climate change?

No, and NASA says so. The Larsen B collapse and the loss of ice in Glacier National Park are tied to warming summers. Columbia Glacier's retreat was probably started by climate but is mostly driven by the glacier's own mechanics, and Lake Powell's decline is drought combined with heavy water use.

How fast did the Larsen B ice shelf collapse?

About 3,250 square kilometres of the Larsen B ice shelf in Antarctica broke apart in just over a month in early 2002, after a series of warm summers on the Antarctic Peninsula (NASA Earth Observatory).

How many glaciers are left in Glacier National Park?

About 150 glaciers were documented in the area in 1850. Surveys in 1968 counted 83 bodies of ice and snow larger than 0.1 km²; NASA Earth Observatory now counts 25 ice bodies.

References

  1. NASA Earth Observatory, World of Change: Collapse of the Larsen-B Ice Shelf
  2. NASA Earth Observatory, World of Change: Ice Loss in Glacier National Park
  3. NASA Earth Observatory, World of Change: Columbia Glacier, Alaska
  4. NASA Earth Observatory, World of Change: Water Level in Lake Powell
  5. NASA Images and Media Usage Guidelines